
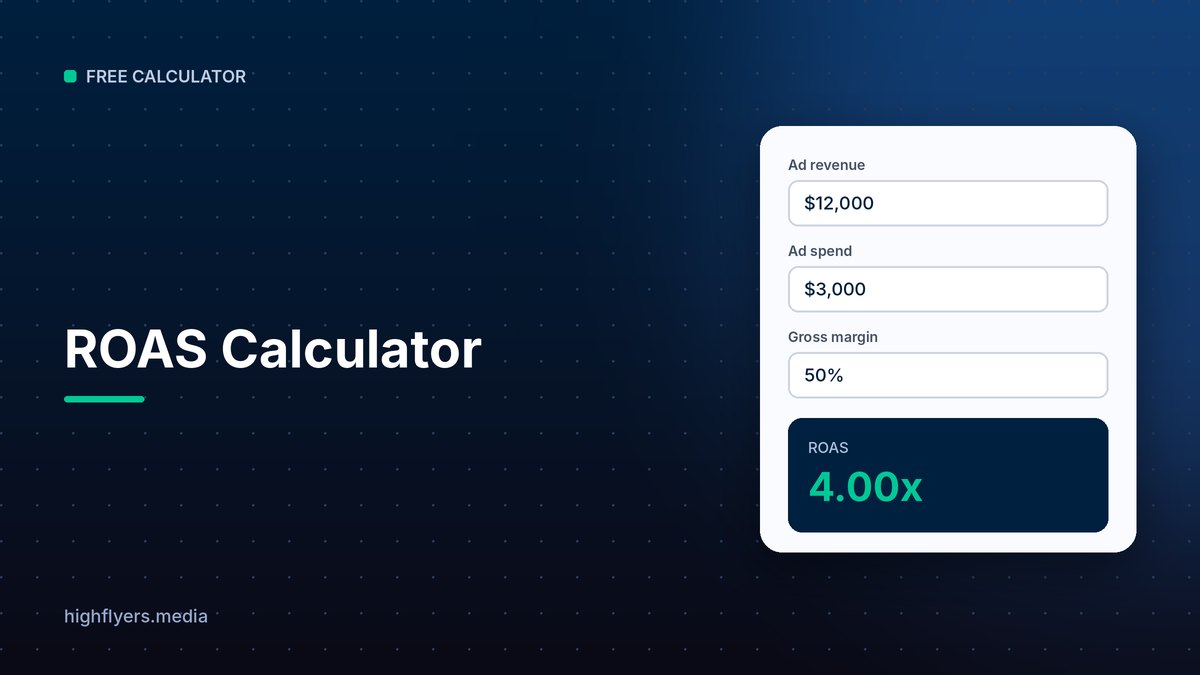



Return on ad spend (ROAS) measures how much revenue each dollar of advertising brings in. This ROAS calculator gives you ROAS for any campaign, and if you add your gross margin, it also shows the break-even ROAS you need to avoid losing money and the profit left after ad costs.
How To Calculate ROAS
- ROAS = revenue from ads / ad spend
- Break-even ROAS = 1 / gross margin
- Profit after ads = revenue x gross margin – ad spend
A campaign that spends $3,000 and brings in $12,000 has a ROAS of 4x, or 400%. With a 50% gross margin, the break-even ROAS is 2x, so this campaign clears it comfortably and leaves $3,000 in gross profit after ad costs.
What Is A Good ROAS?
There is no single good number, because the target depends on margin. A business with a 25% margin needs at least 4x ROAS to break even, while one with an 80% margin breaks even at 1.25x. Set your target from your break-even ROAS, then add room for overhead and profit. For subscription products, judge ROAS against customer lifetime value rather than first-order revenue, using our LTV calculator.
Frequently Asked Questions
What is the difference between ROAS and ROI?
ROAS compares revenue with ad spend only. ROI compares profit with total investment, including product costs, fees and labor. A campaign can show a strong ROAS and still lose money if margins are thin.
Why does ROAS differ between ad platforms and my store?
Each platform uses its own attribution window and model, and several platforms may claim credit for the same sale. Compare platform-reported ROAS with revenue in your own analytics or store data before you shift budget.
